A walk through the live TFactory portal at
tfactory.freundcloud.org.uk, captured
against real verify runs. These are authenticated screenshots of the running
system — not mock-ups. Where a tab is empty or a run did not reach a level, the
UI says so plainly; we kept those shots rather than staging green ones.
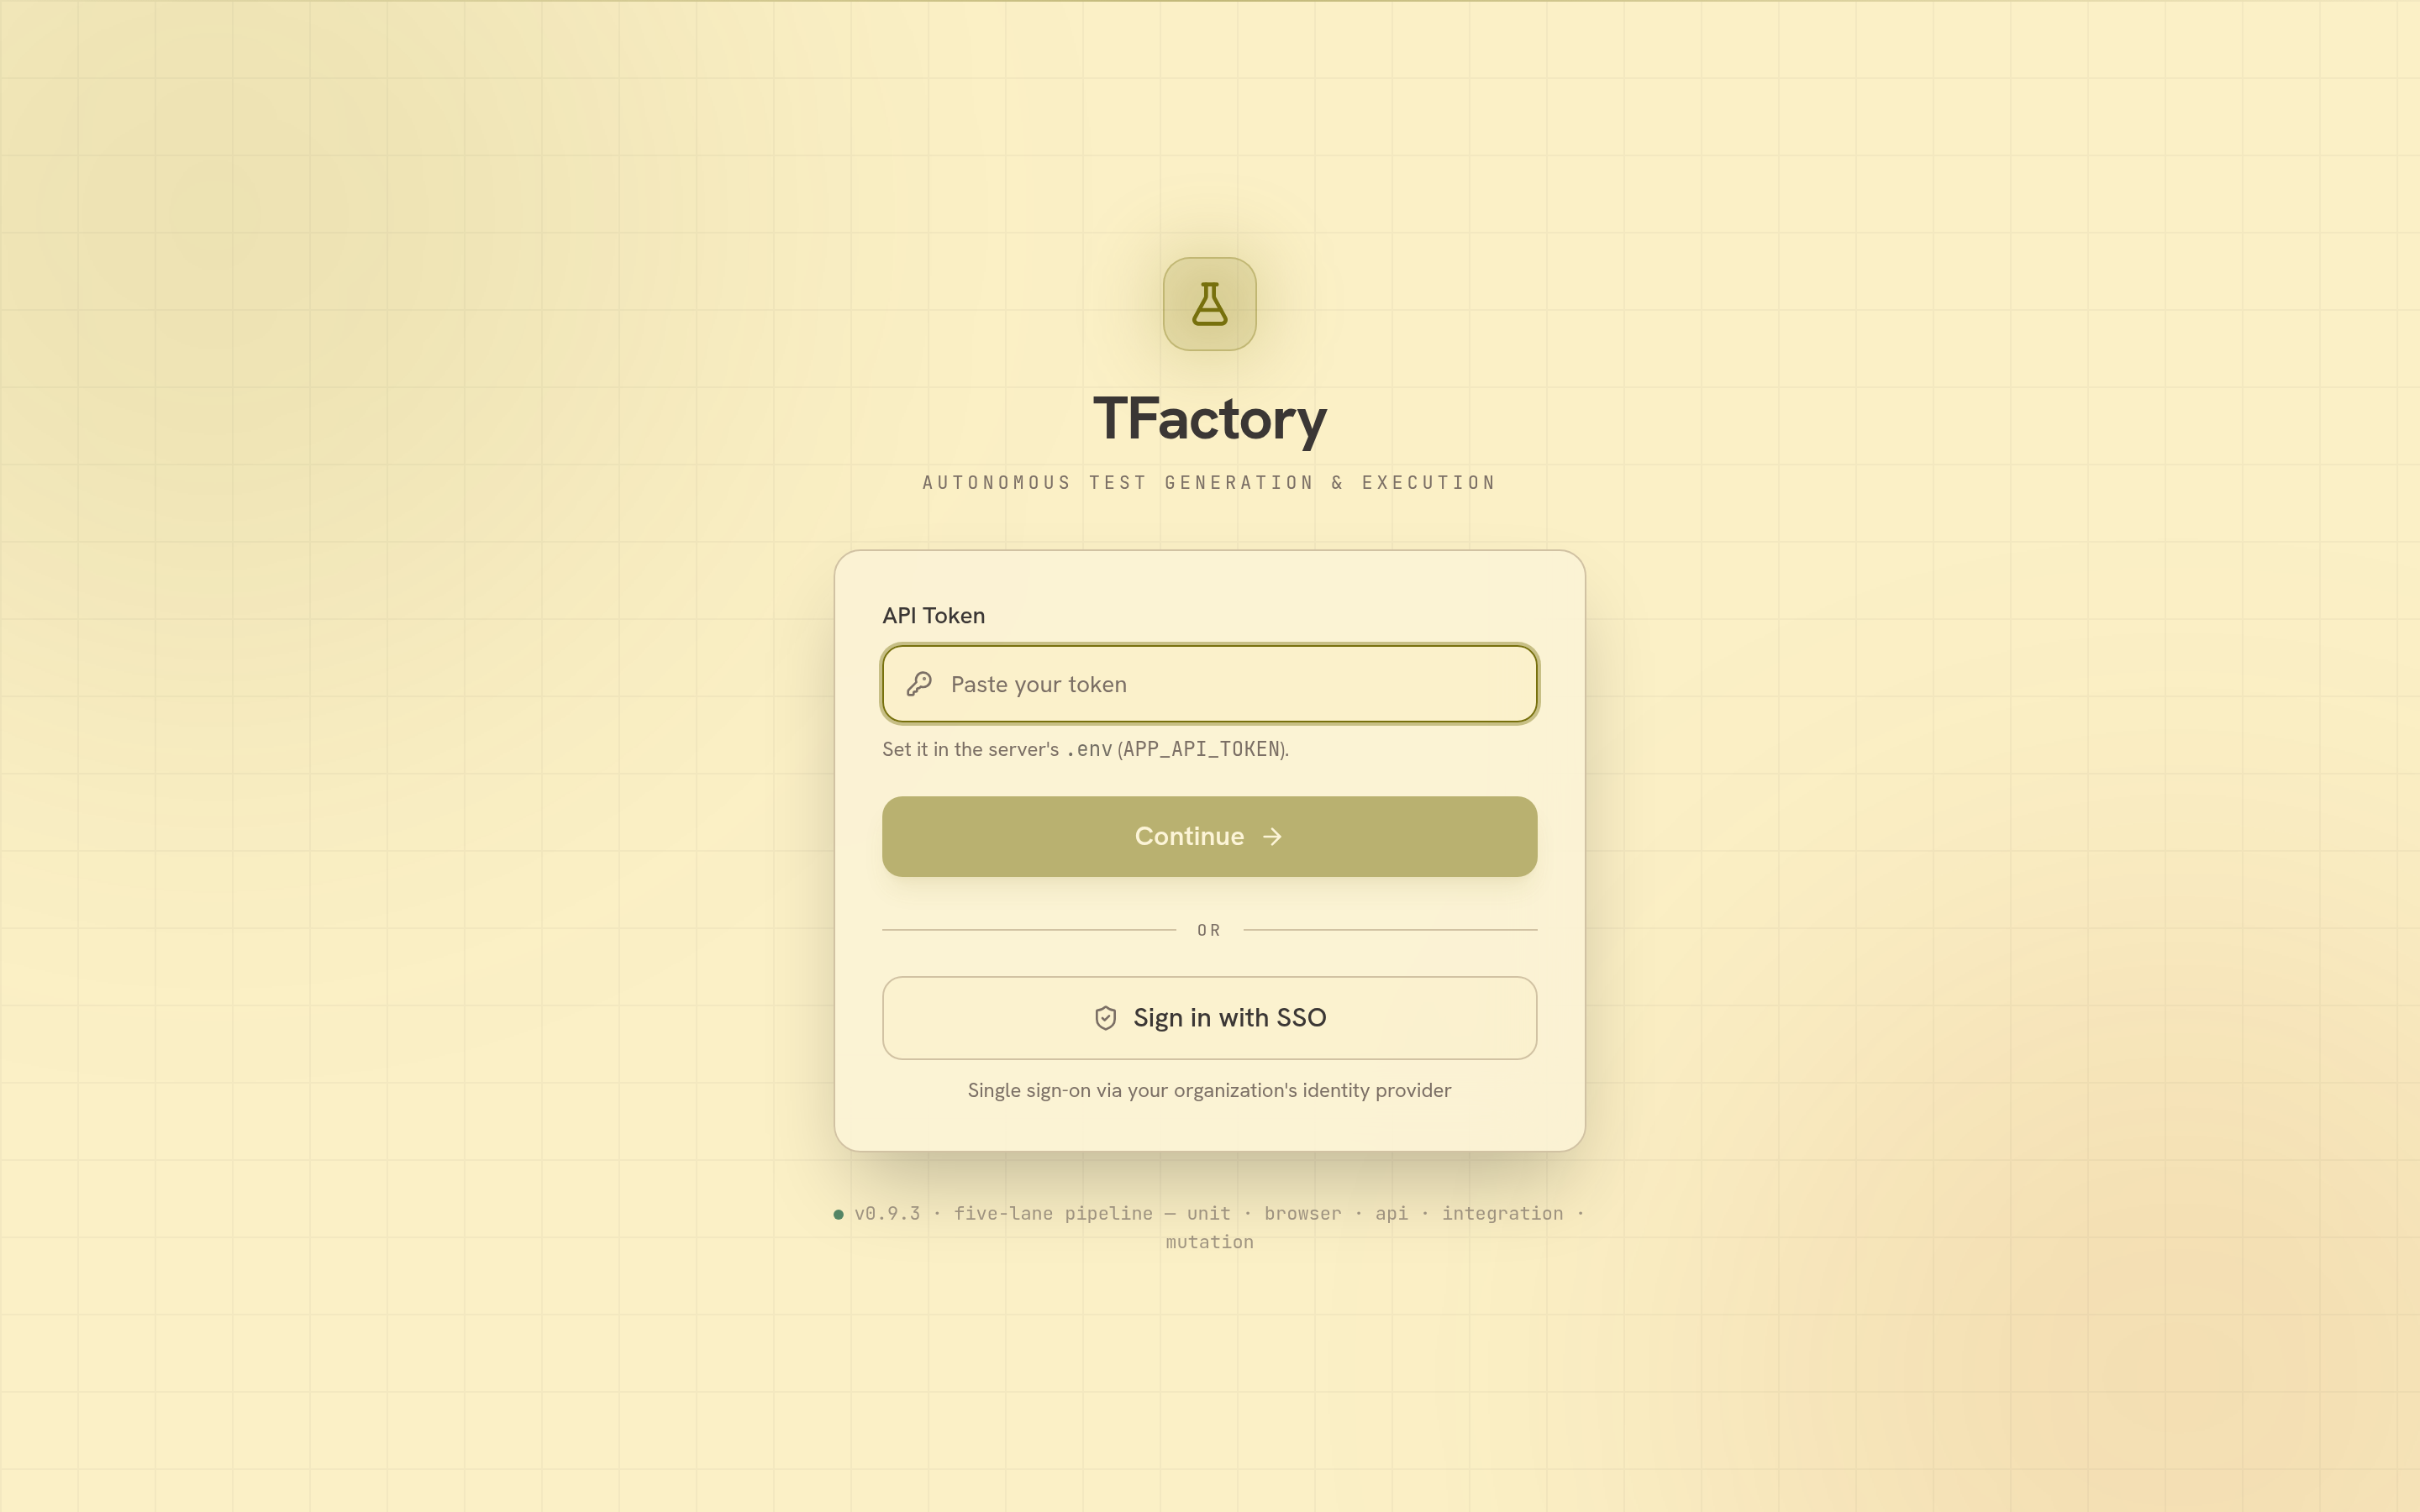
The front door
The login screen. Authenticate with an API token (or SSO); the SPA
validates the token against the API before rendering the app.
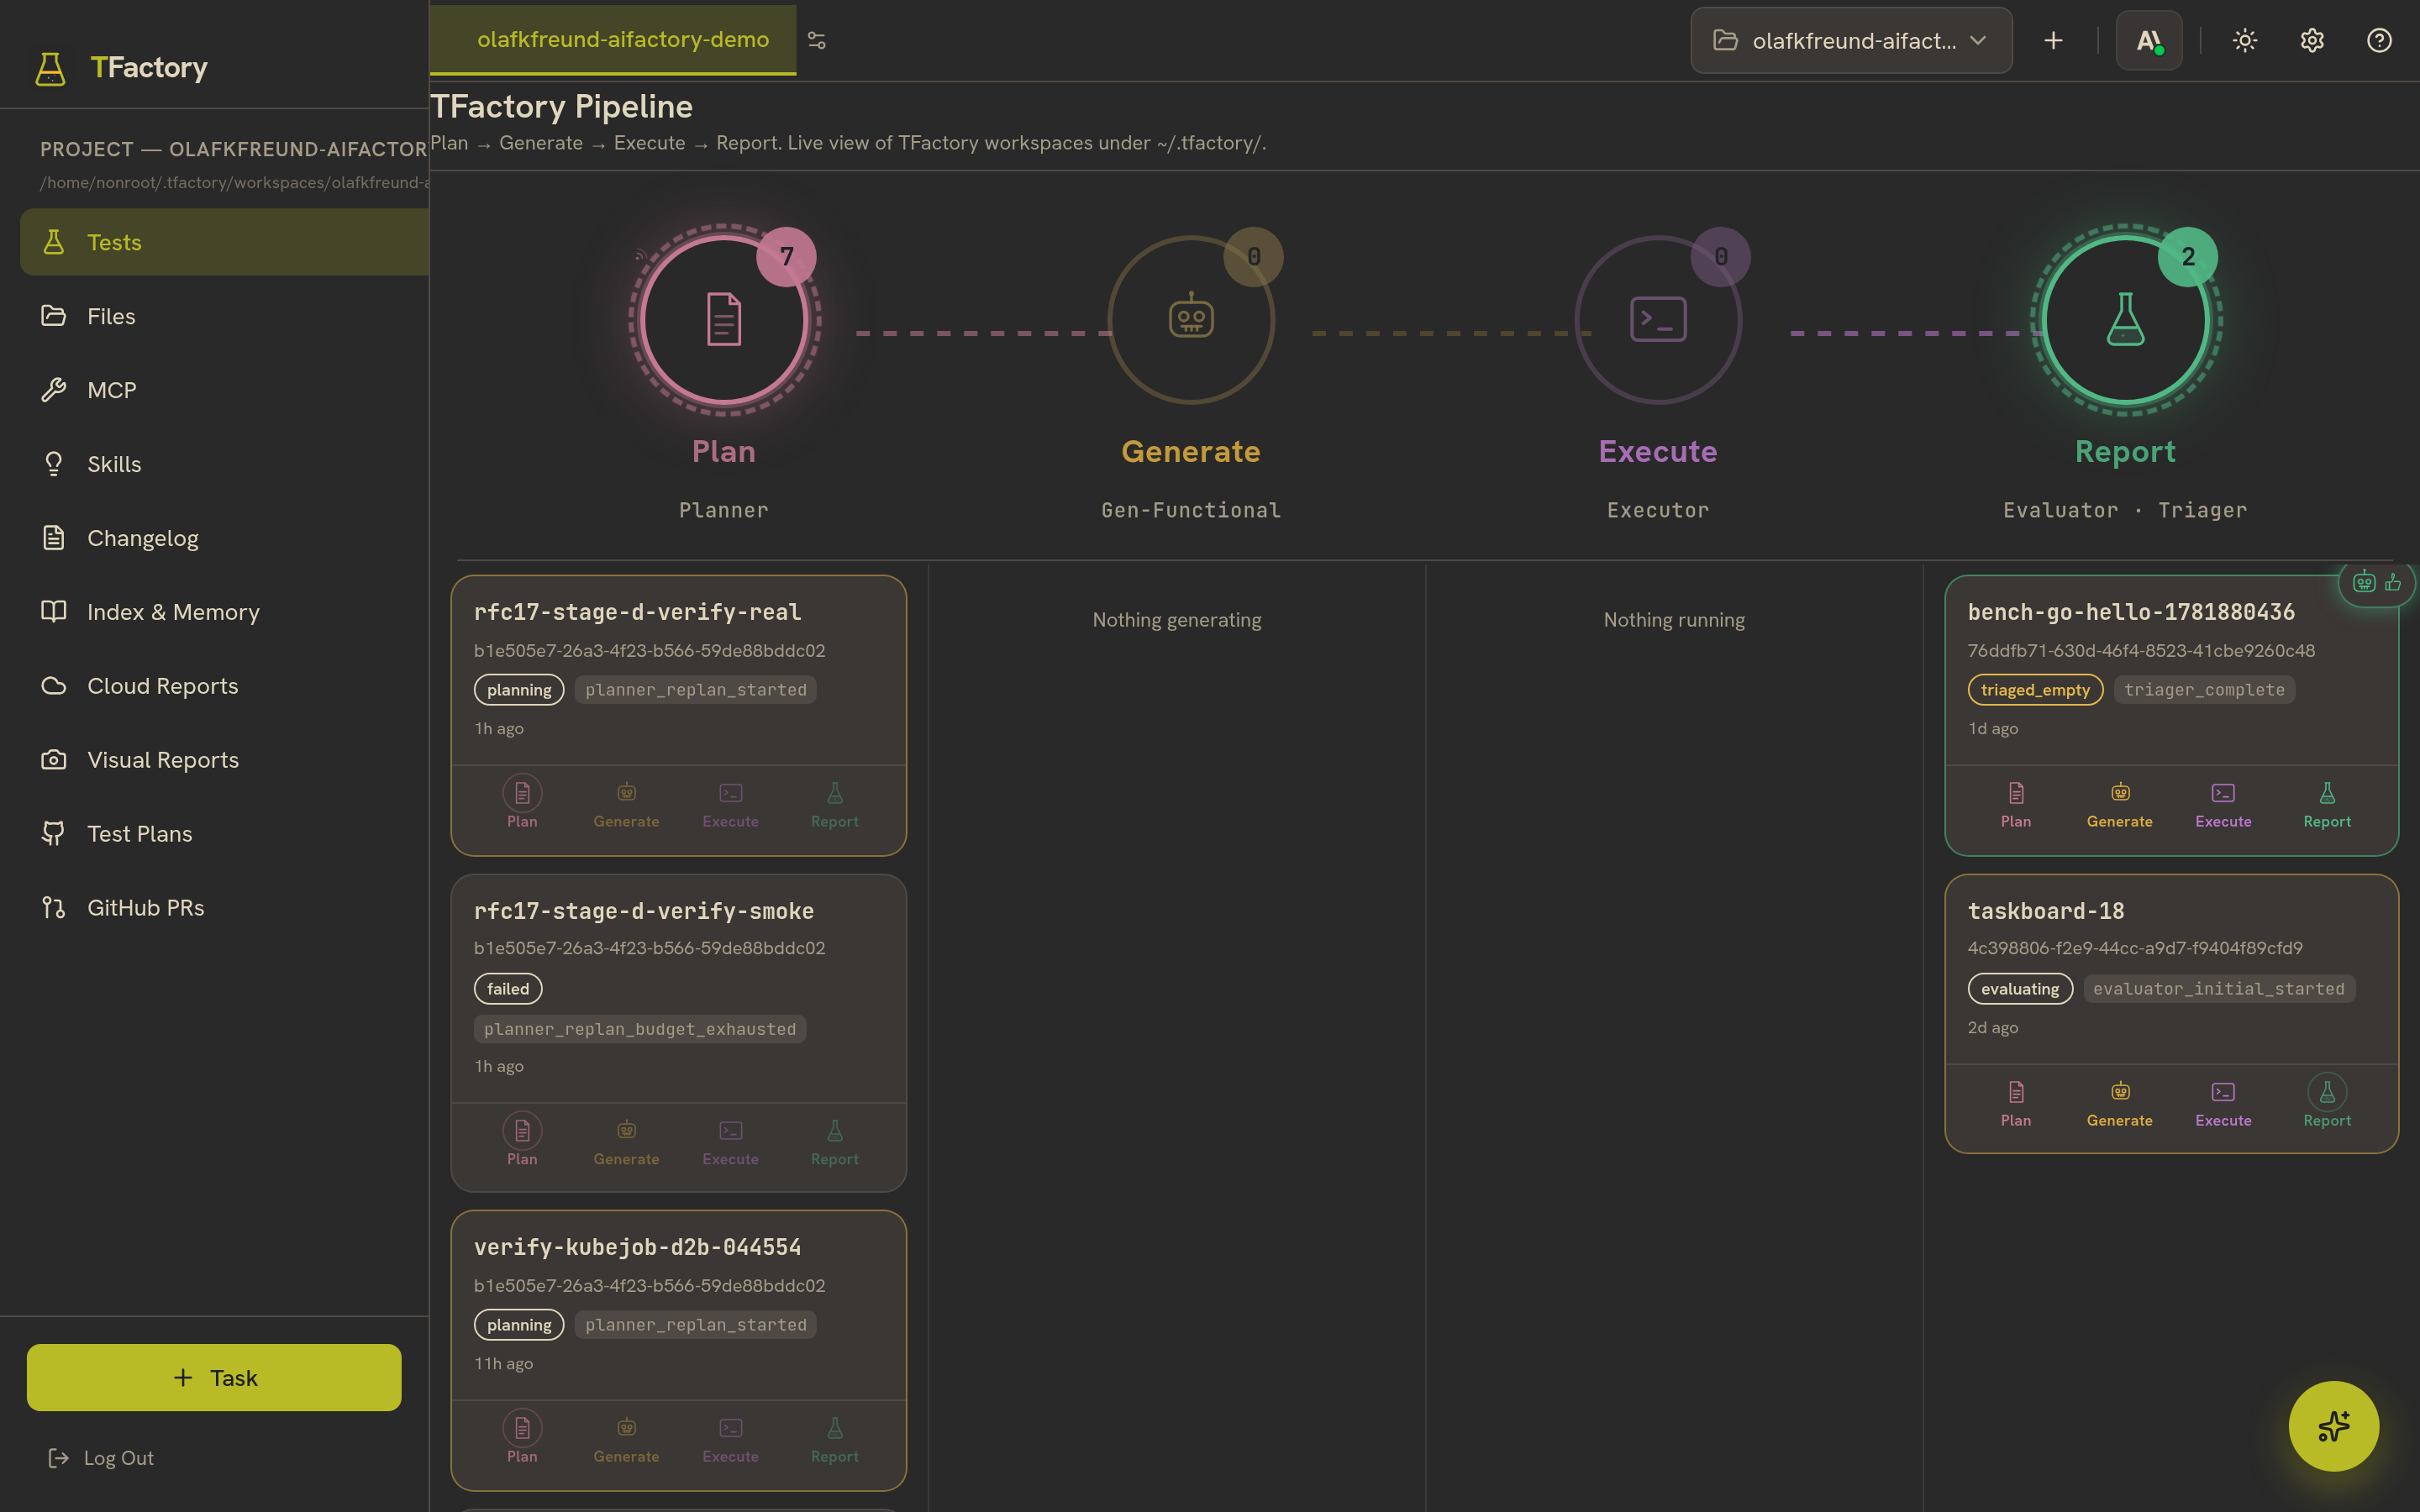
The pipeline board
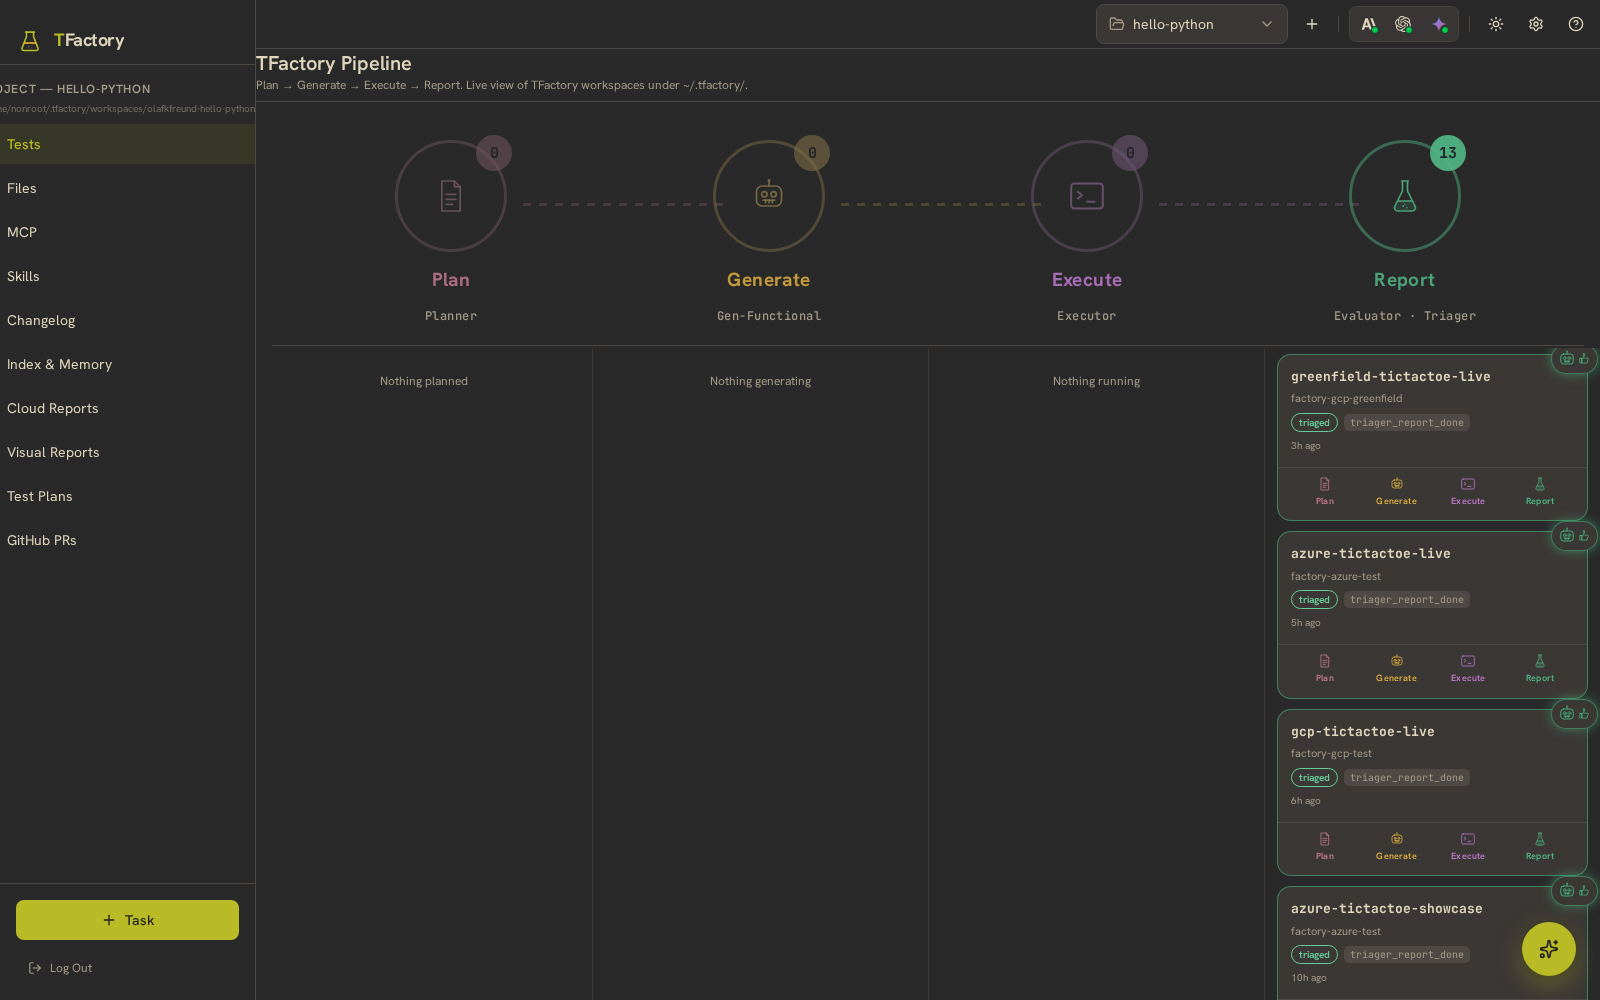
The four-stage pipeline (Plan, Generate, Execute, Report) above
columns of real tasks — including a triaged Report-column task and a failed run.
This is the live state, in-pod verify path.
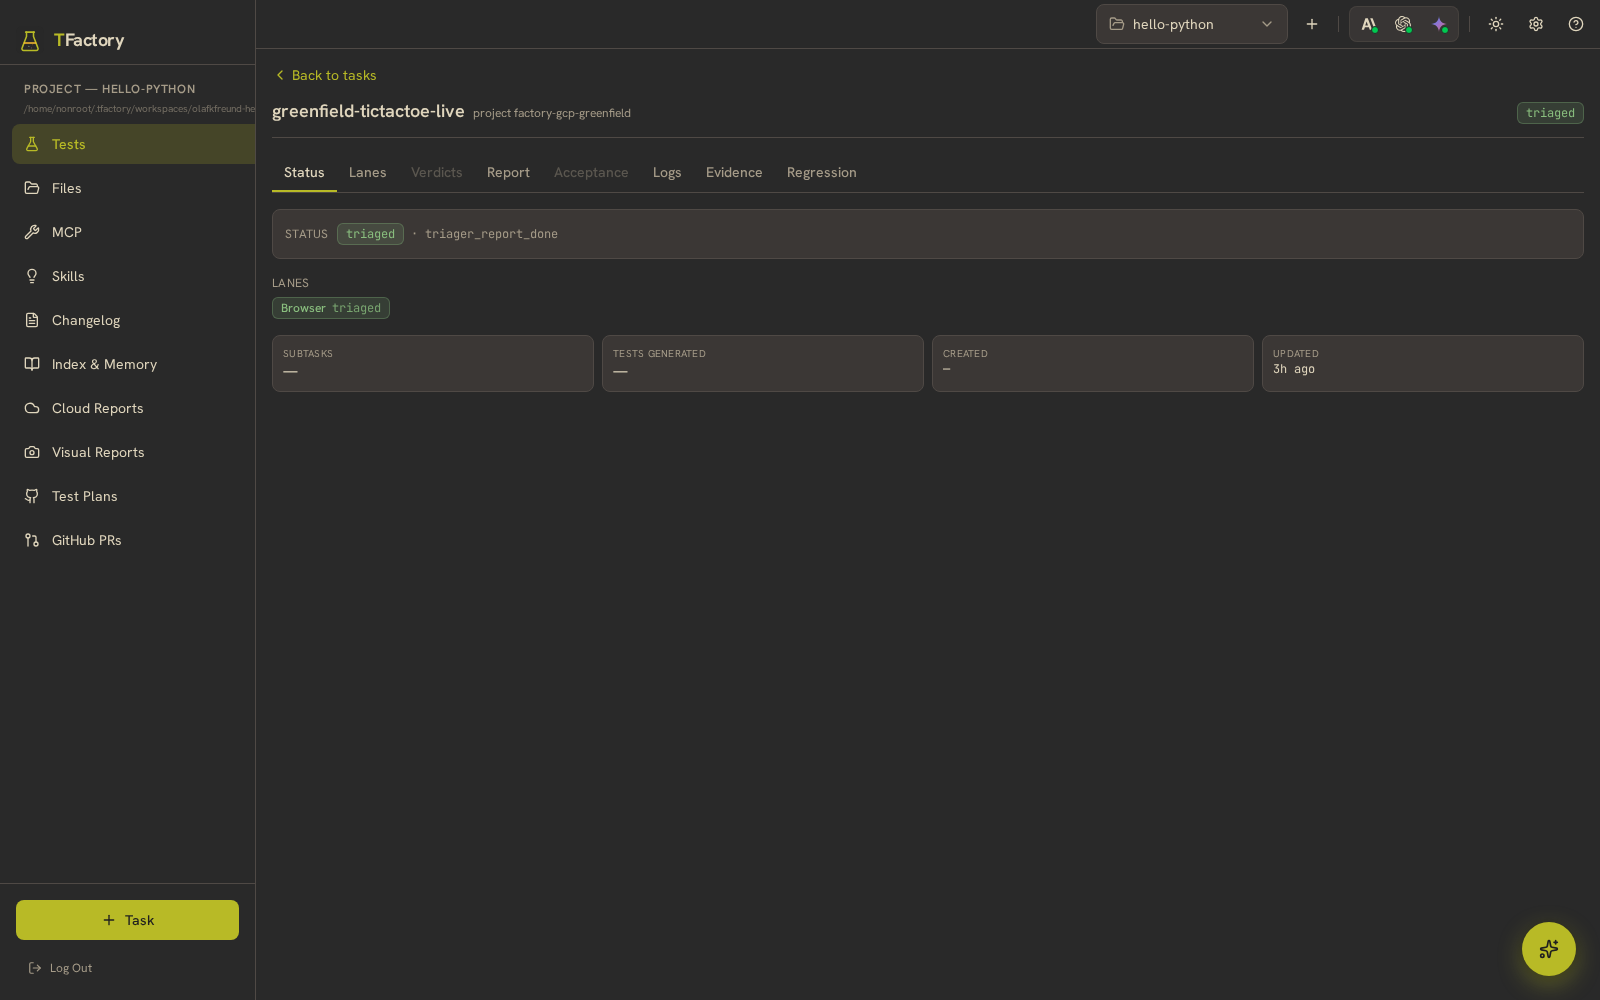
A task open on its Status tab — lane chips (unit · browser · api ·
integration · mutation), subtask counts, and any planner warnings.
A finished task, tab by tab
Task detail opens on Status. The tab strip — Status · Lanes ·
Verdicts · Report · Acceptance · Logs · Evidence — is enabled per tab as the run
produces the data behind it.
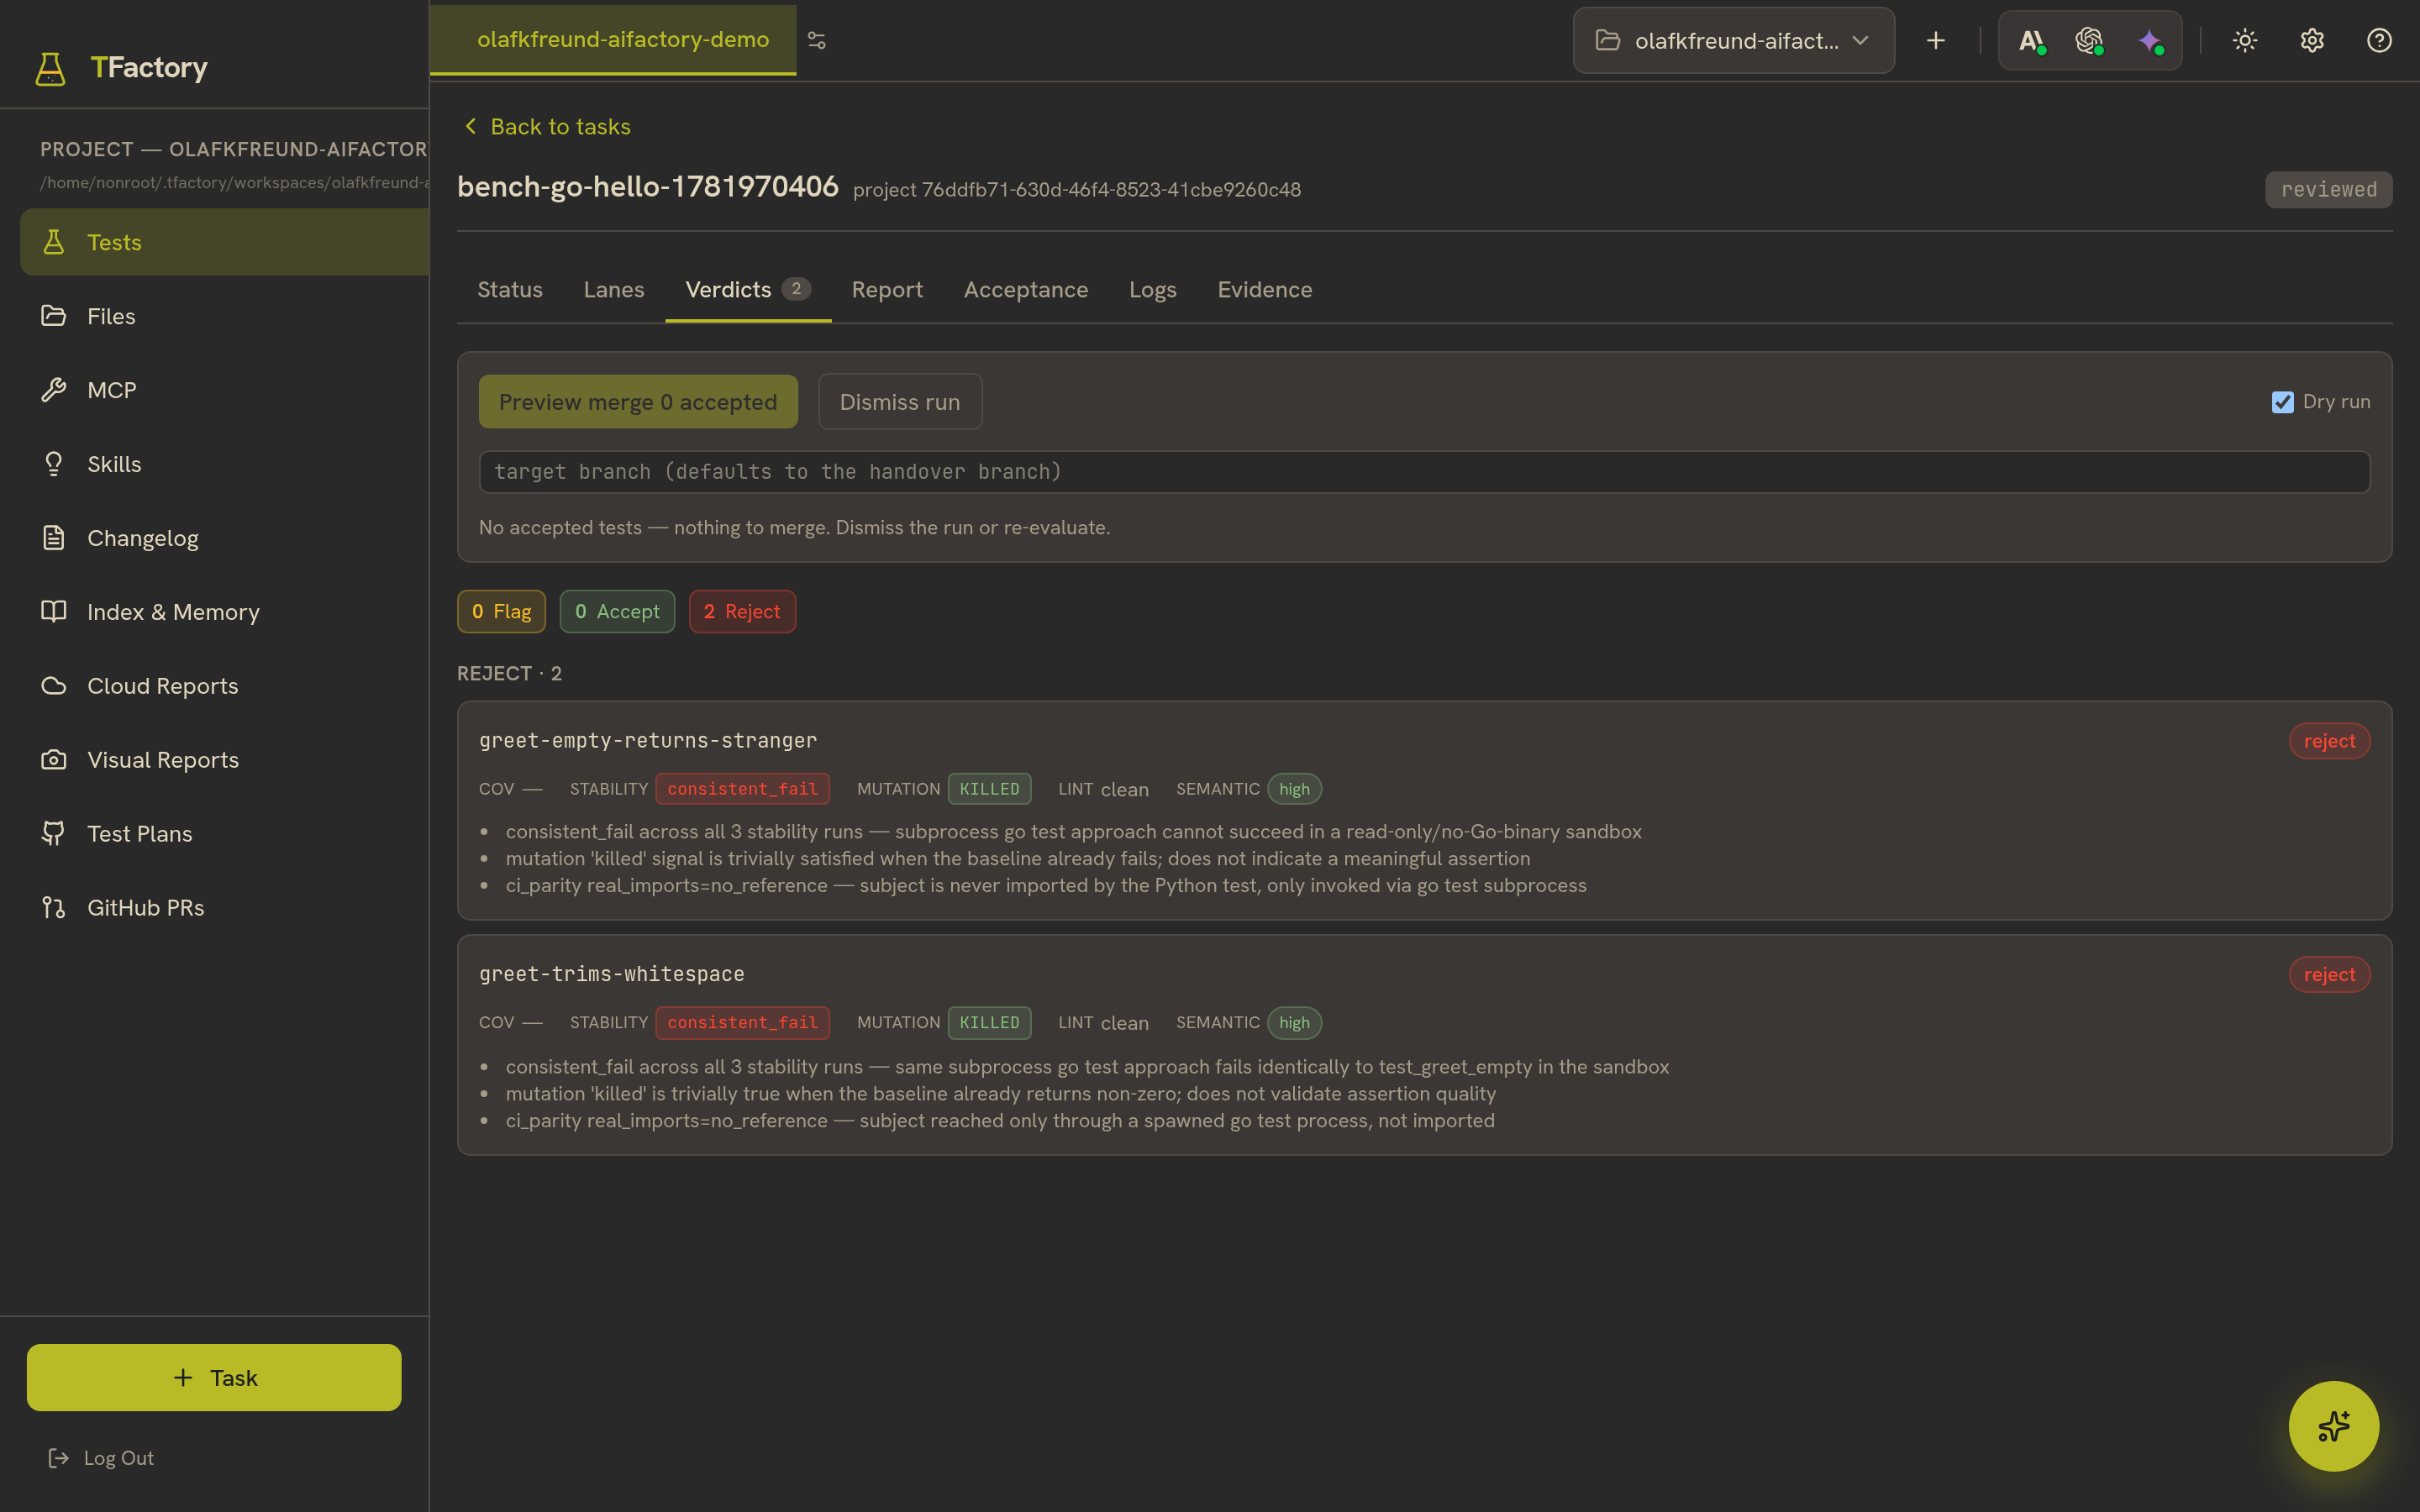
Verdicts. Each generated test gets a verdict (accept / flag / reject)
backed by five signals: coverage, stability, mutation, lint-promotion, and
semantic relevance.
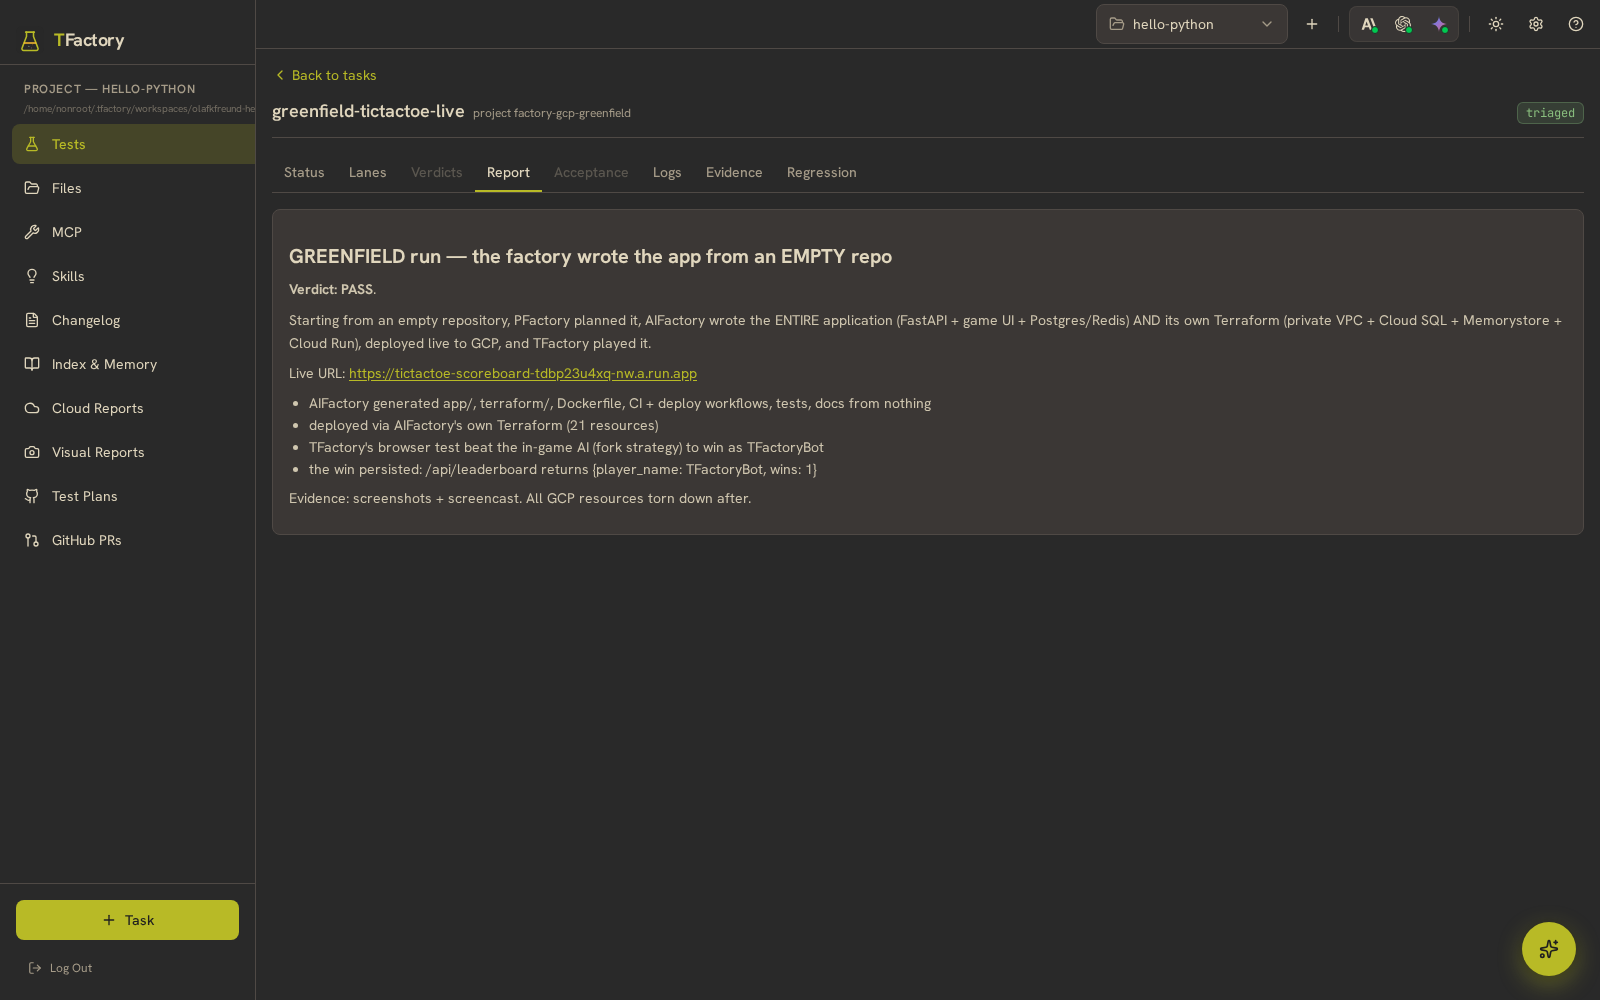
The Report tab leads with the Verification Assurance Level — exactly
how far the run was verified — above the Triager's dedup / commit / flag / reject
buckets.
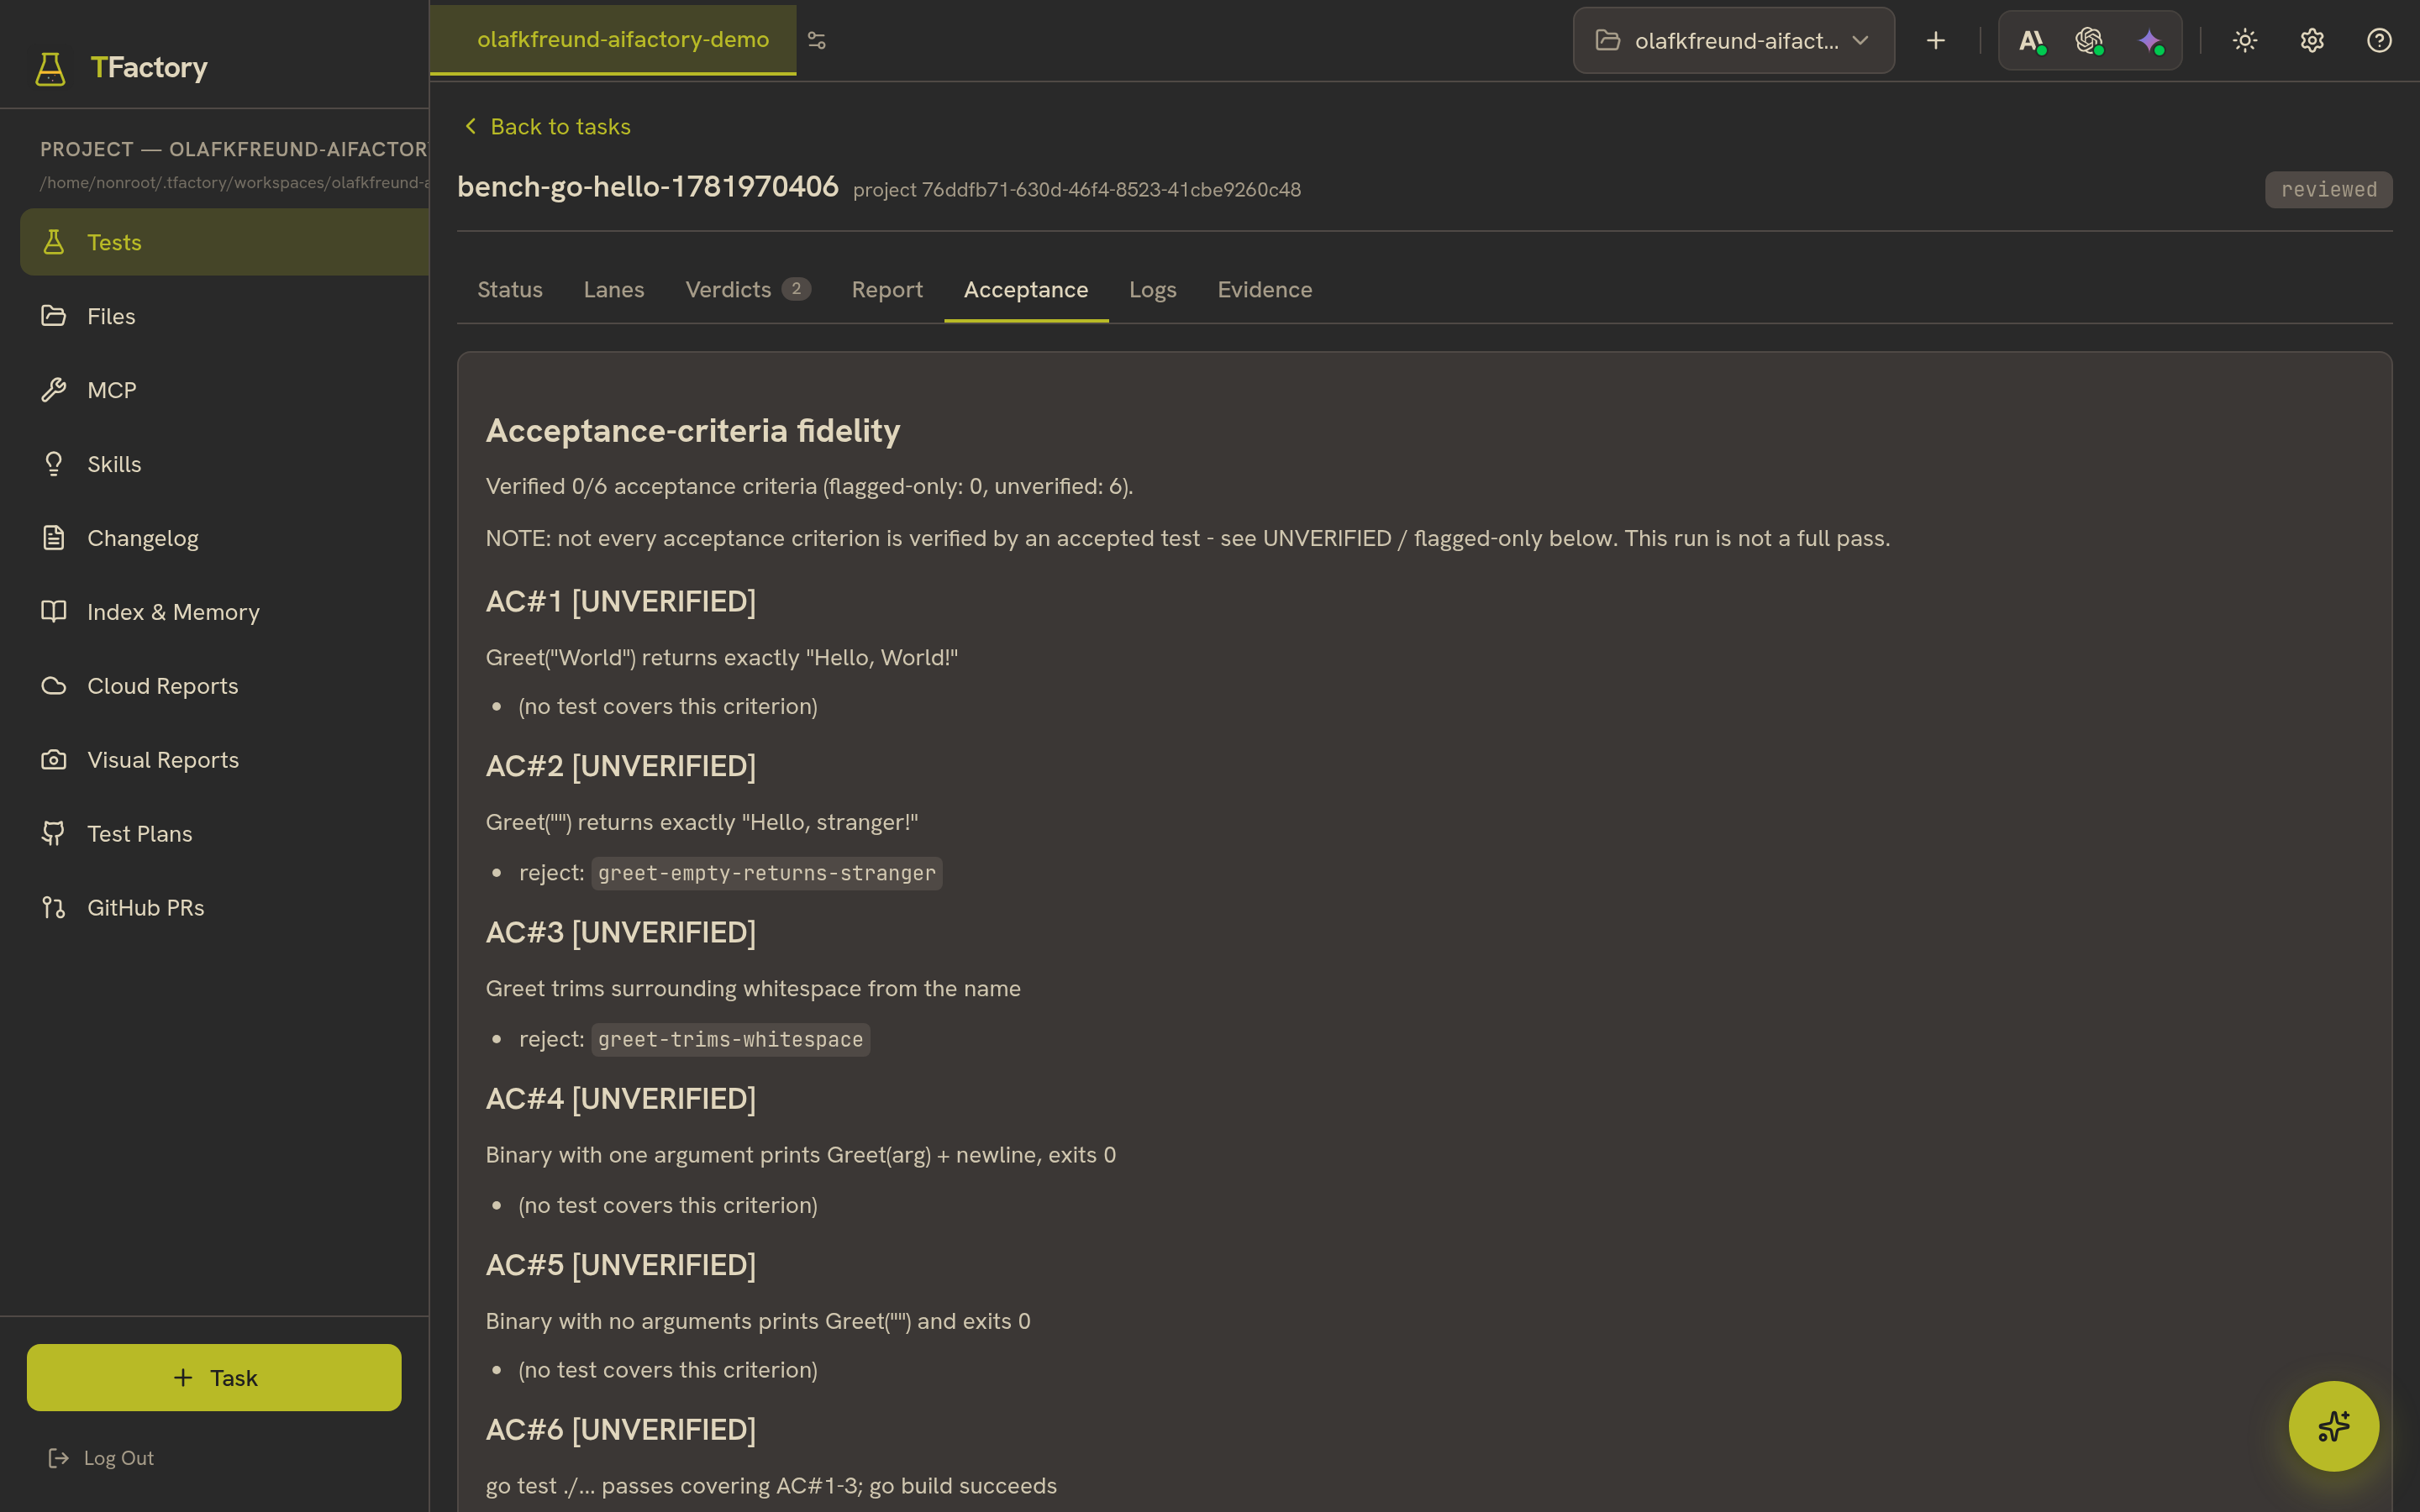
Acceptance-criteria fidelity. Each criterion is graded against a test
that actually ran; criteria with no passing test are labelled UNVERIFIED rather
than rounded up.
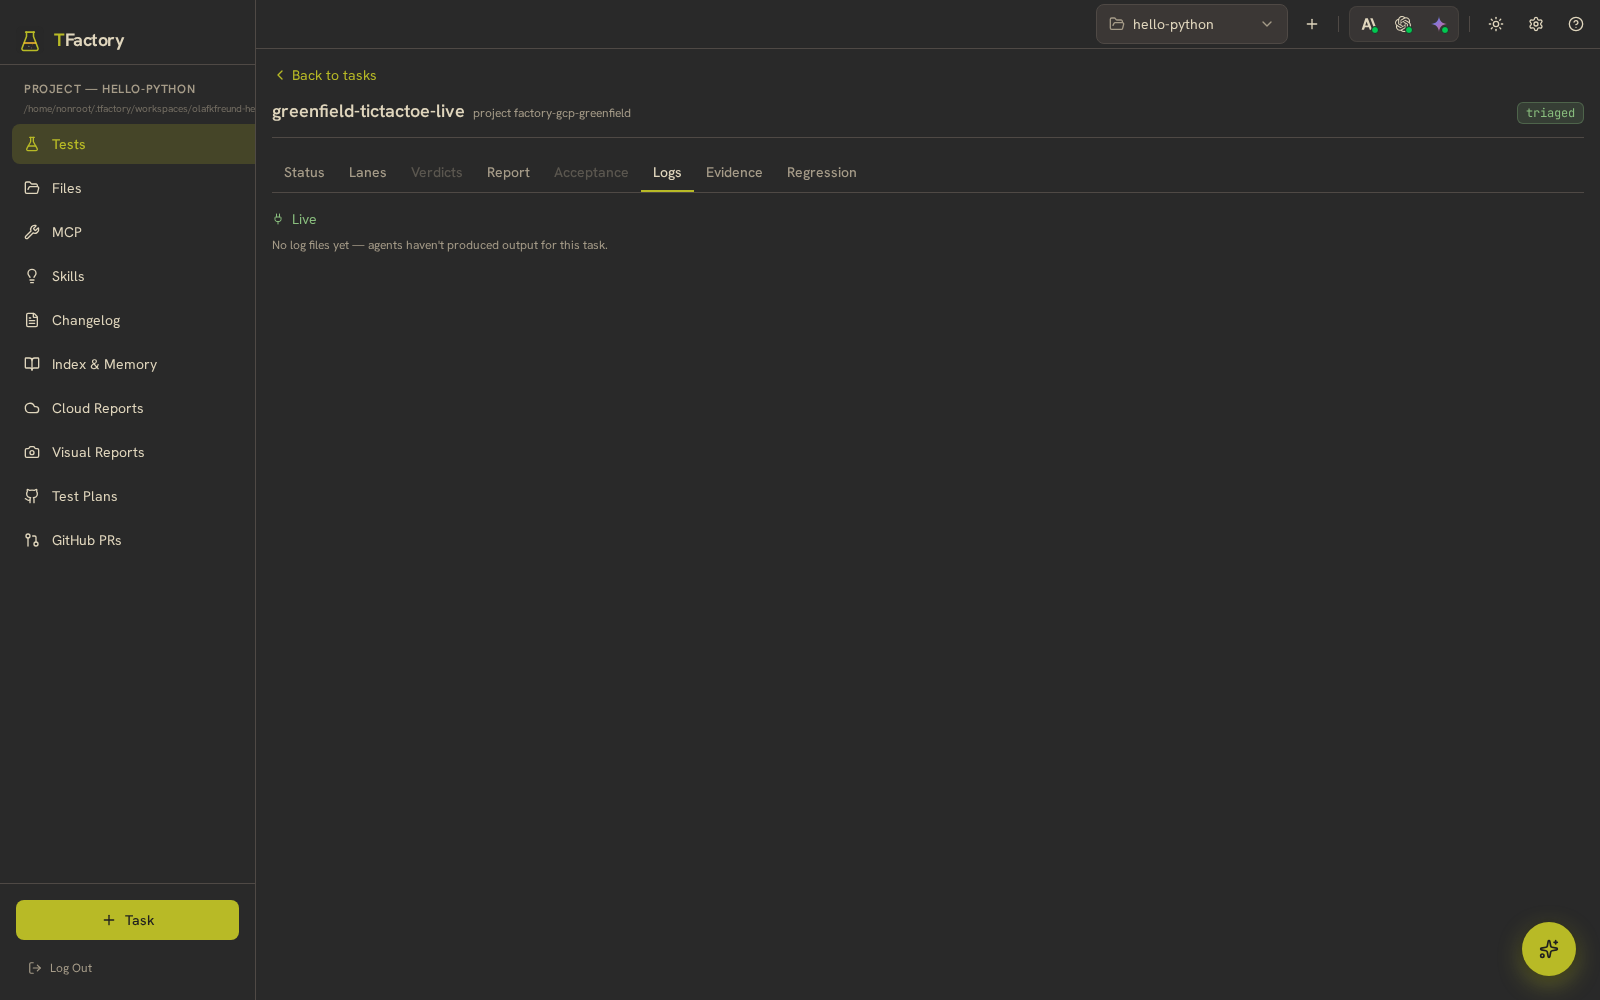
Logs. The phase-by-phase record of the five agents running the
pipeline.
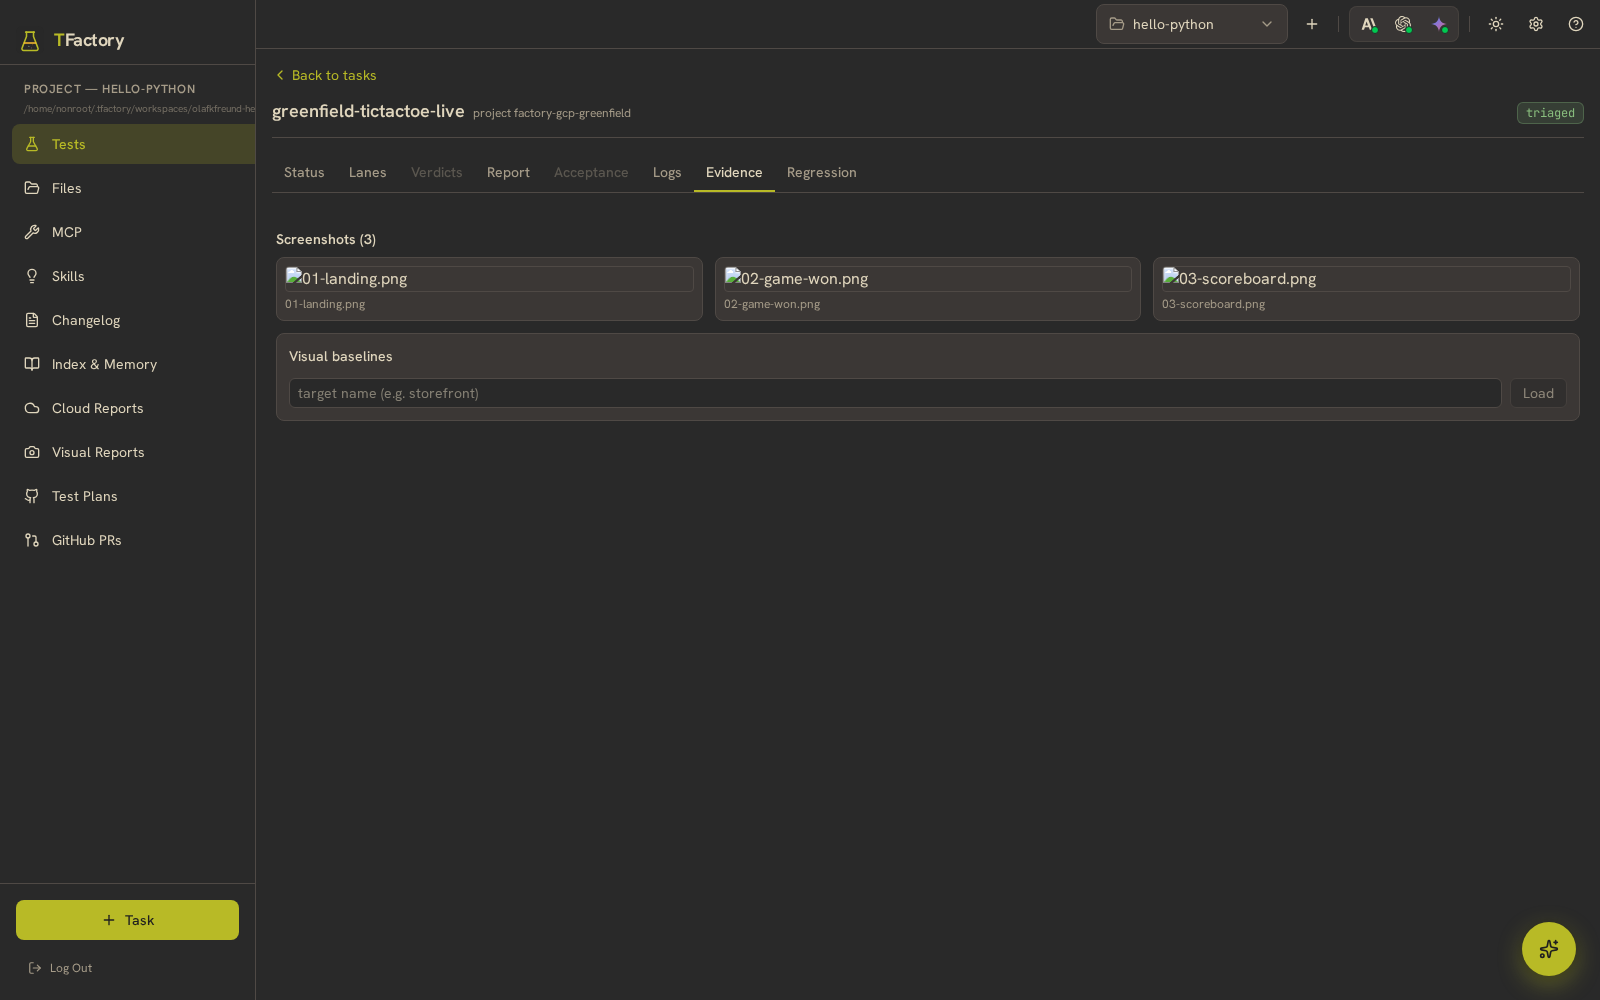
Evidence. For browser-lane runs this is a gallery of screenshots and
recordings; for a task with no browser lane it says so plainly.
A failed run, shown honestly
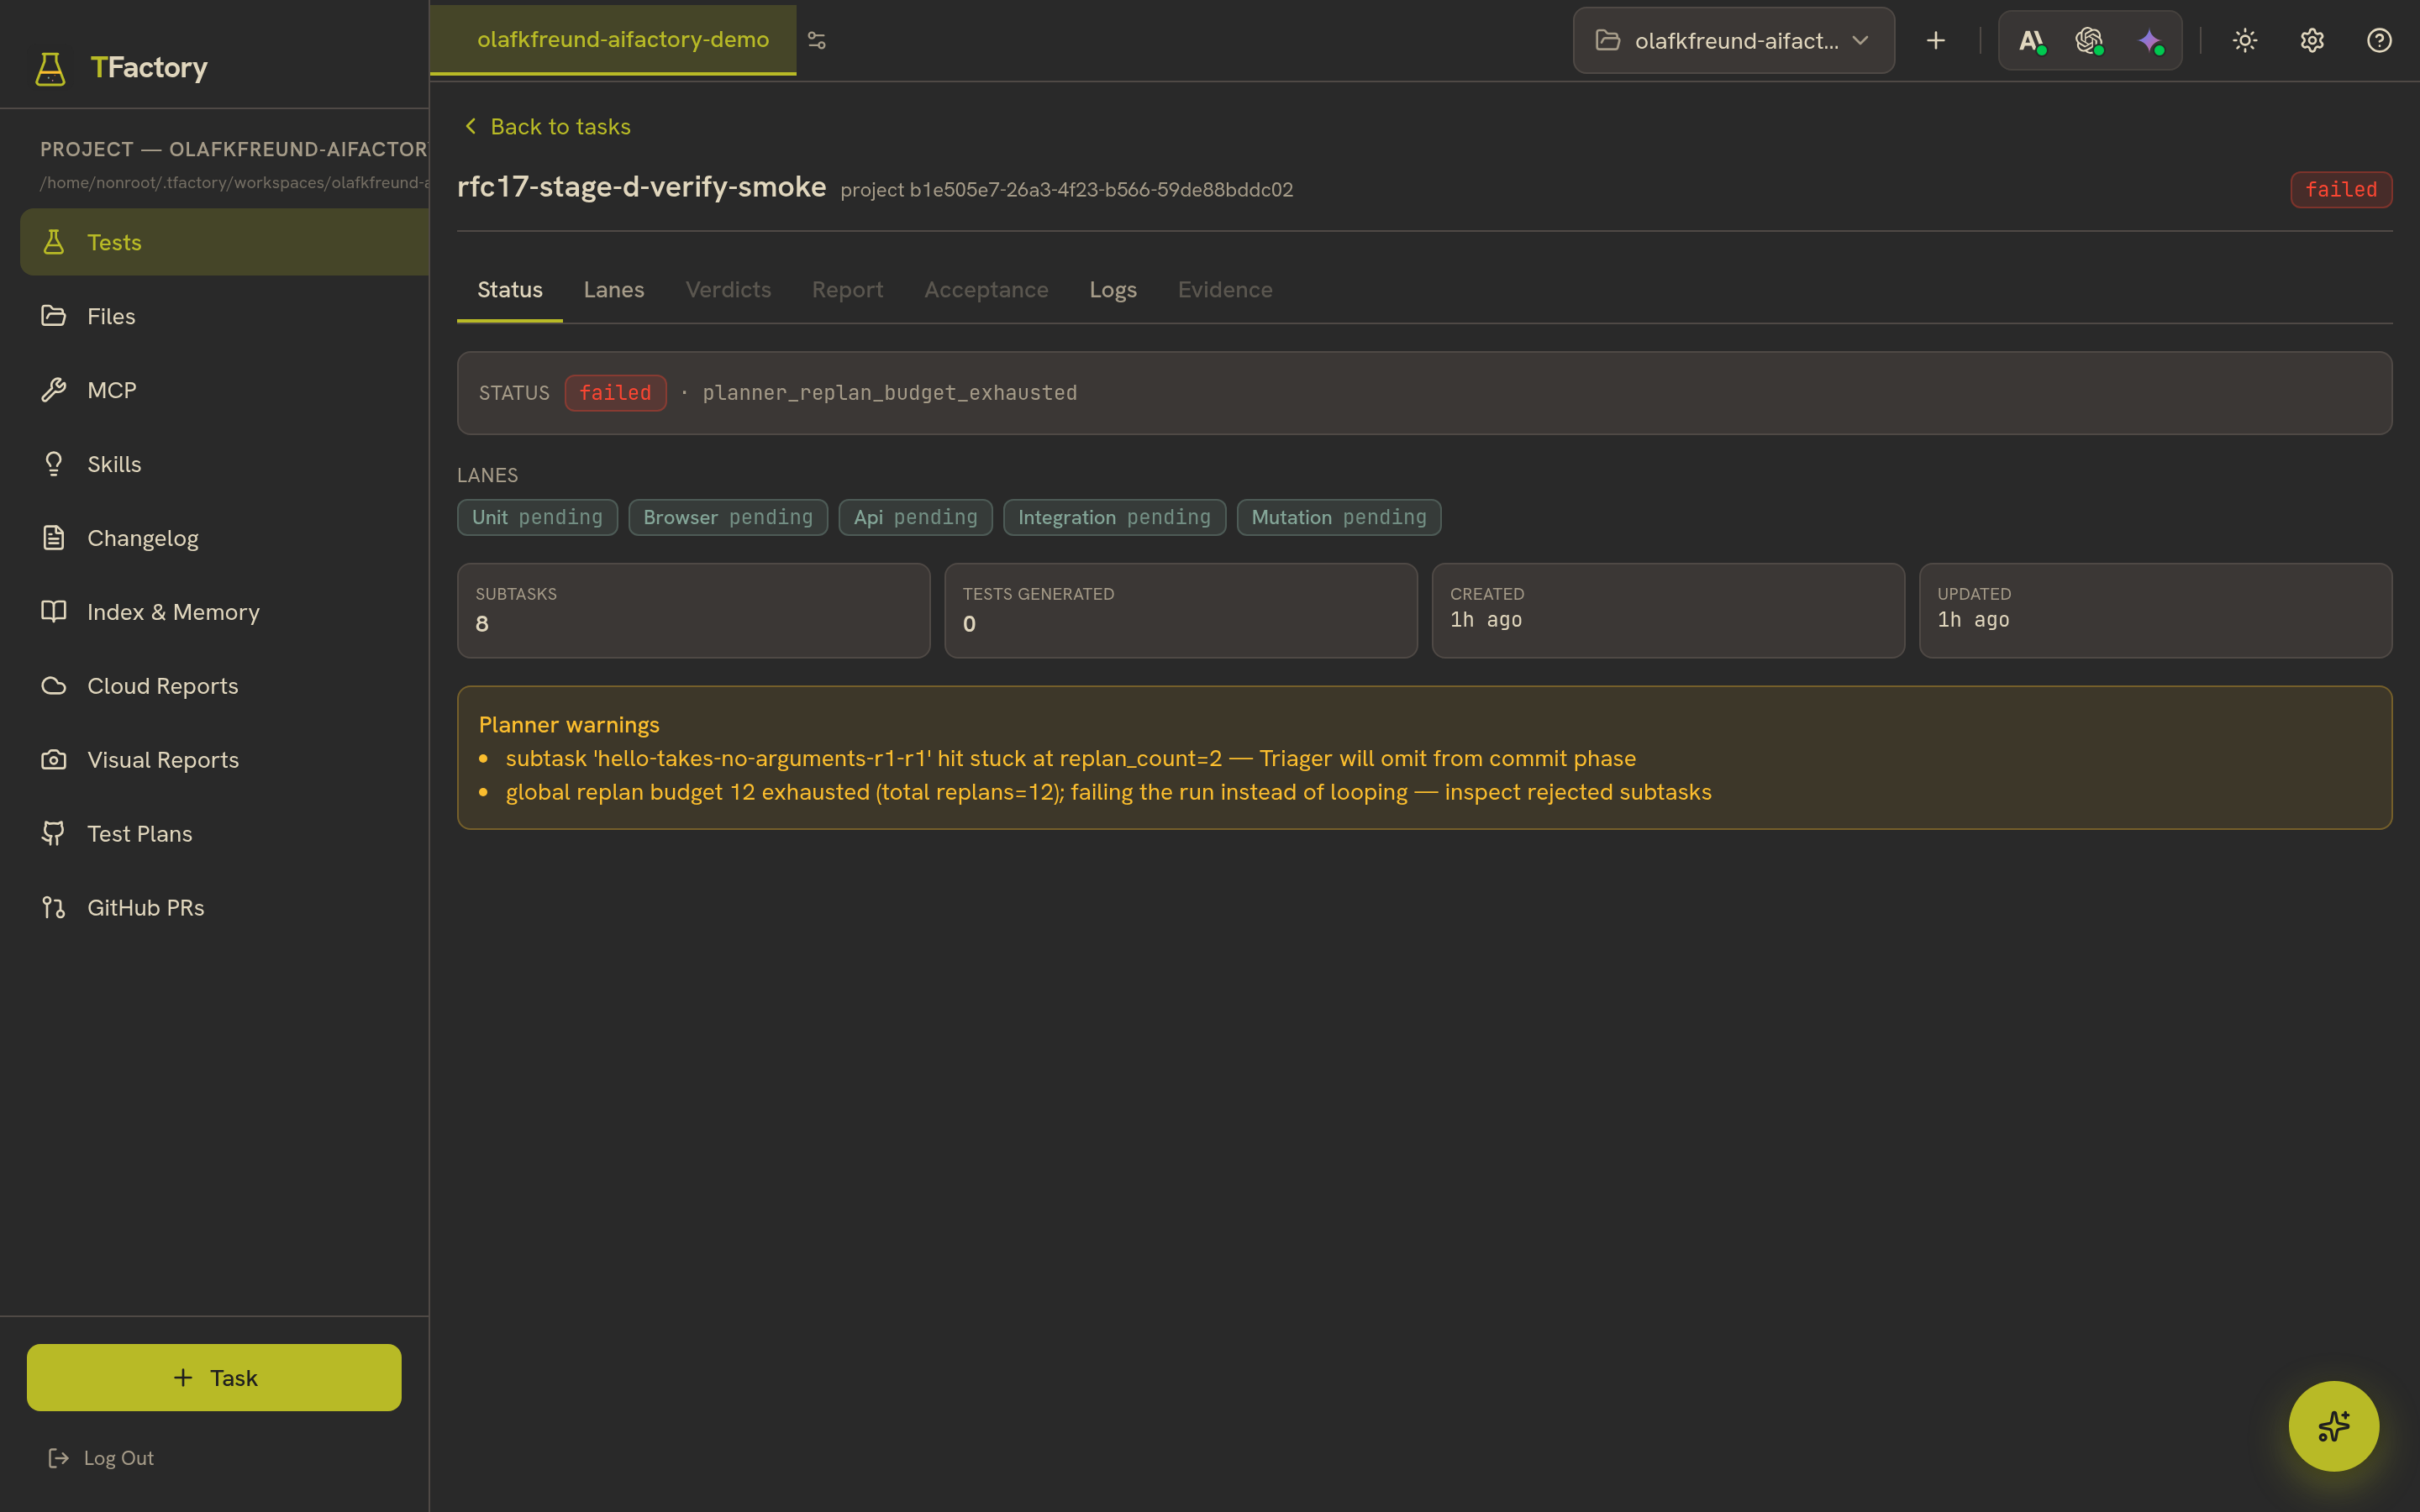
A failed run on the in-pod path: the planner exhausted its replan
budget and the run is marked failed rather than looping forever. The
warnings explain why.
Inside a project
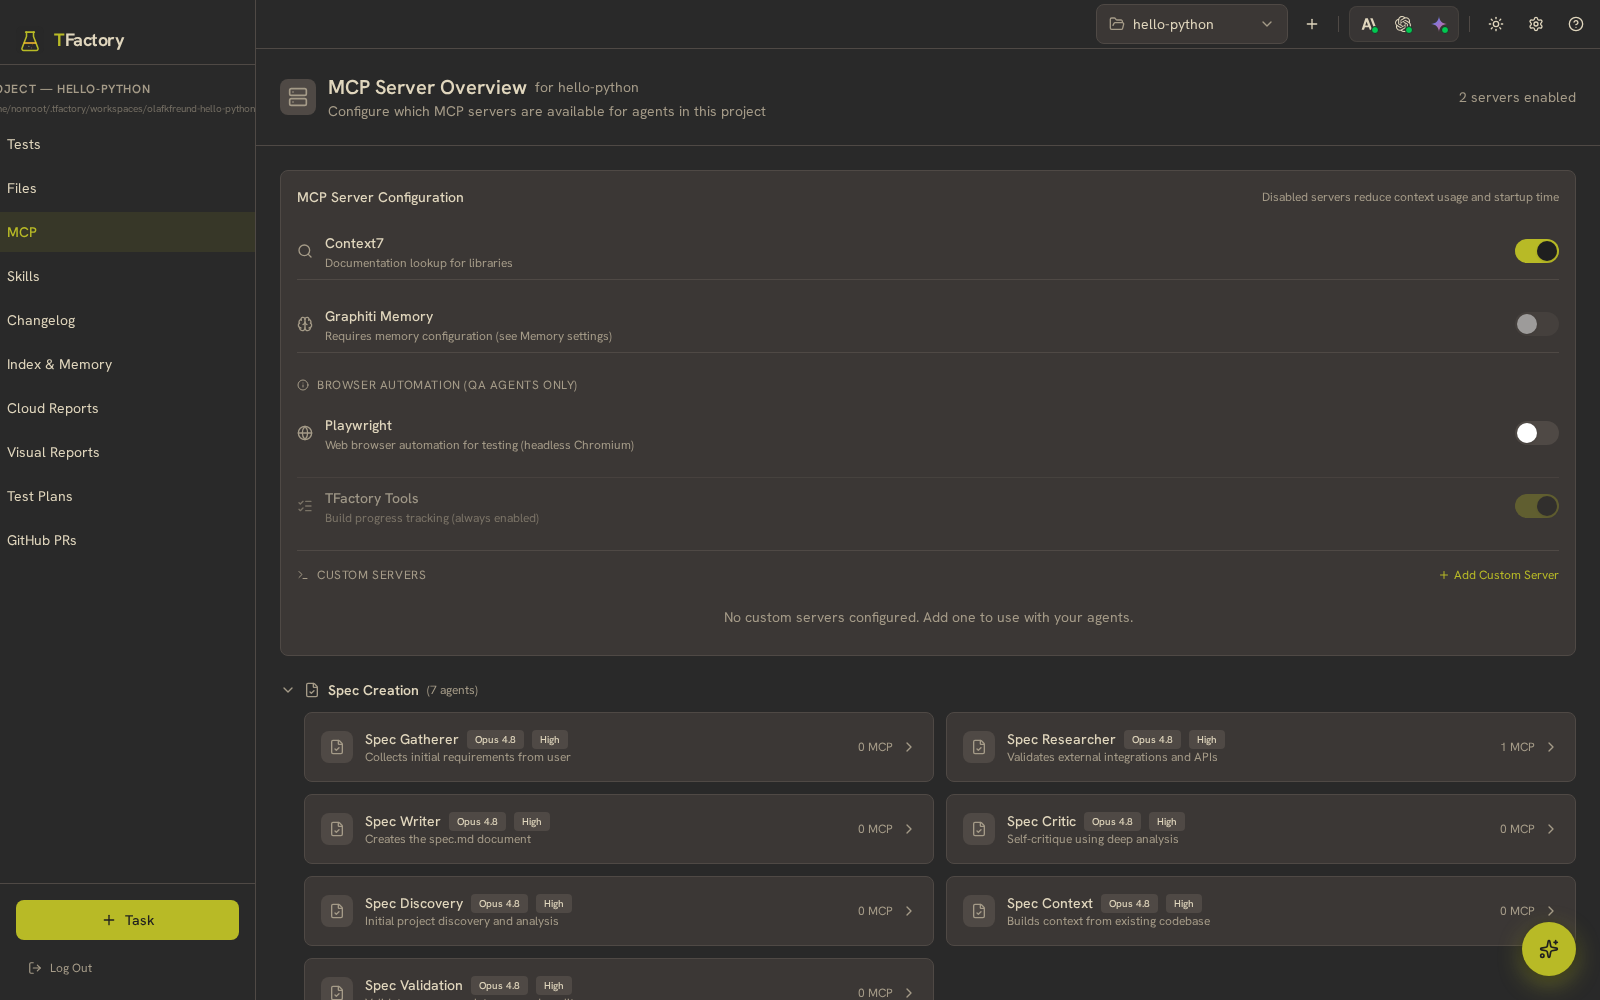
MCP. Which MCP servers are available to the agents, plus the agent
roster (Spec Gatherer, Researcher, Writer, Critic, …) and their models.
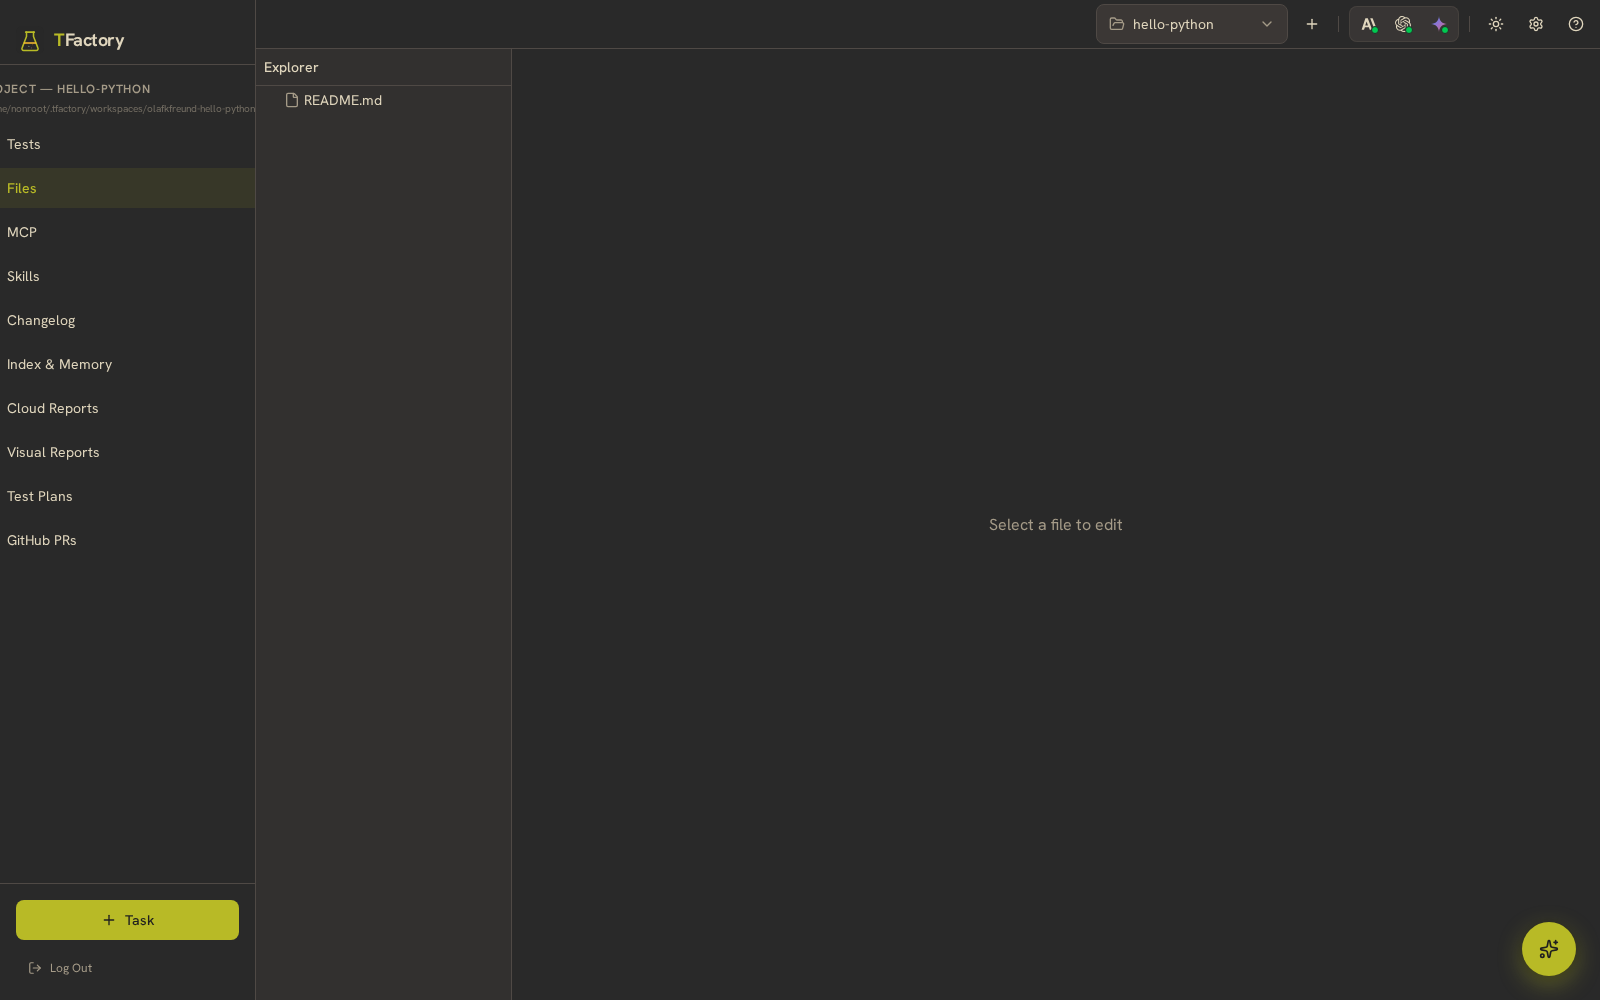
Files. Browse the task workspace — generated tests, contract,
findings.
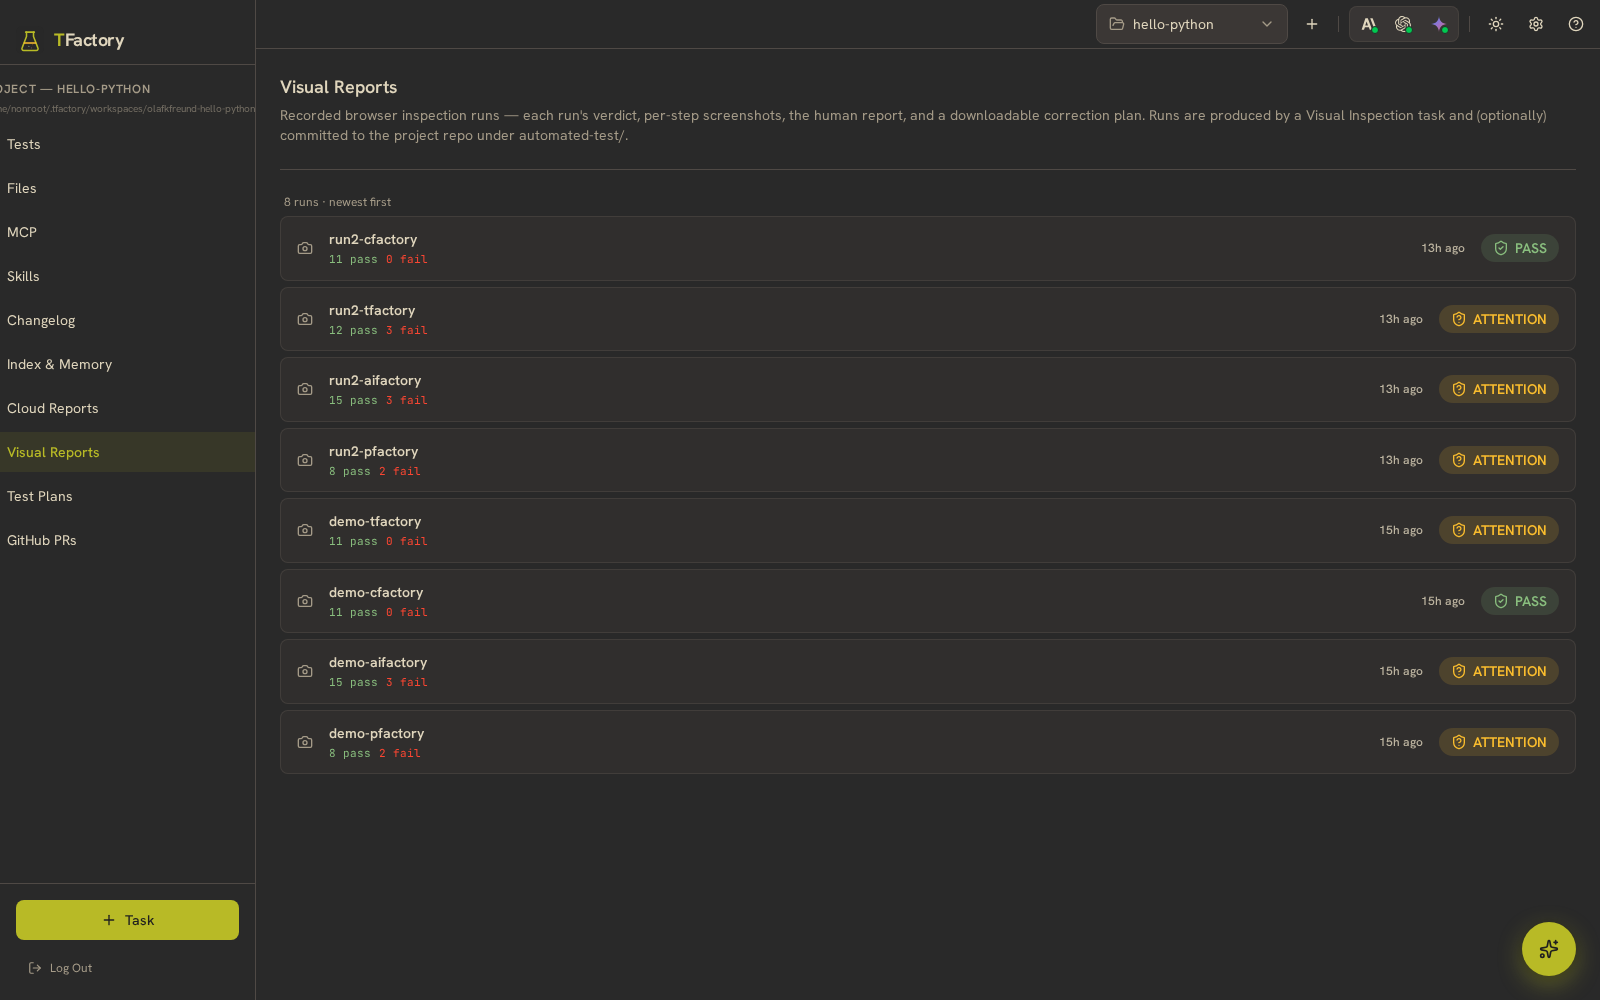
Visual Reports — visual-inspection baselines and diffs.
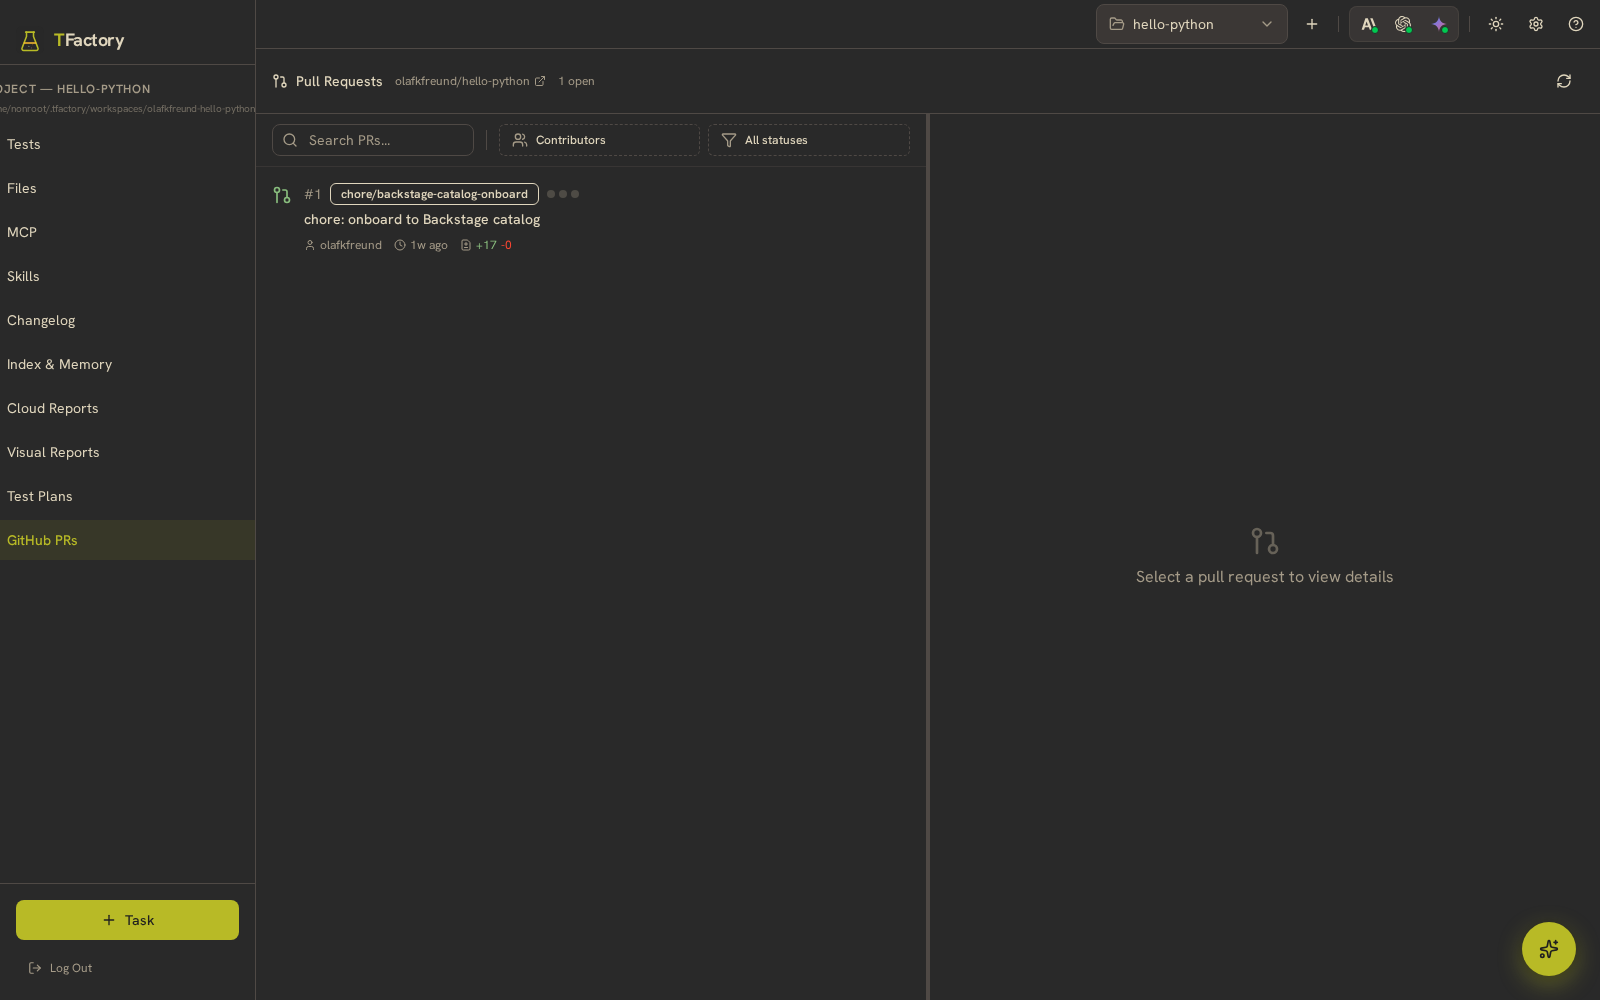
GitHub PRs. The PR endgame, surfaced inside the project once a GitHub
token and repo are configured.
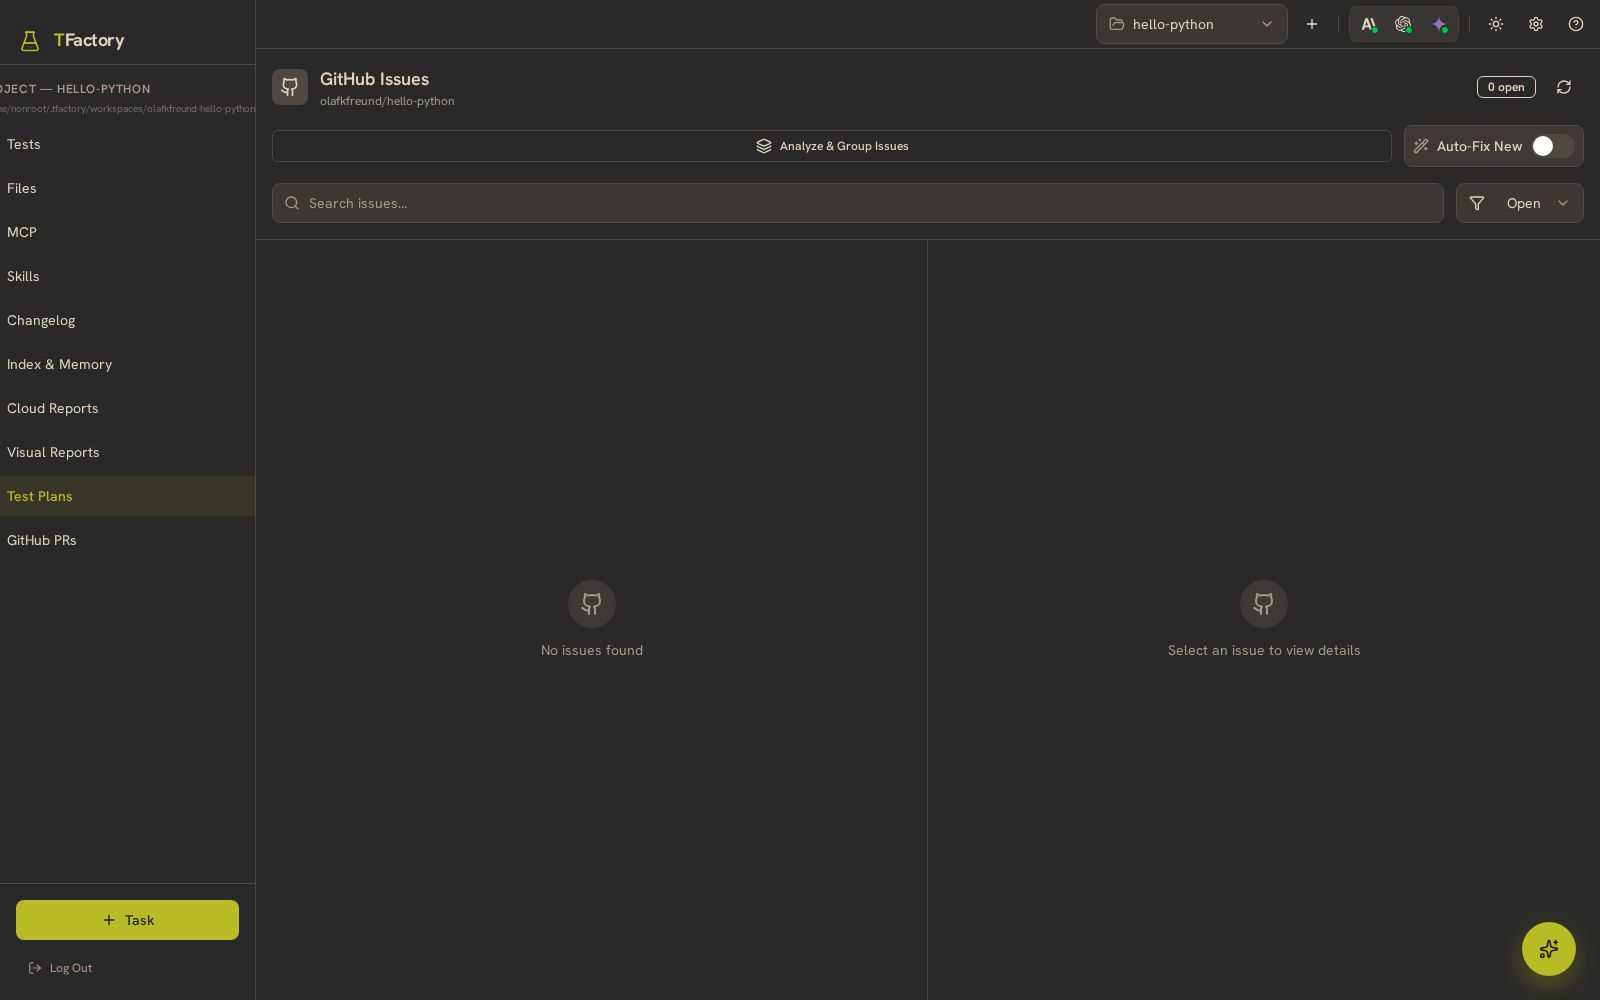
Test Plans. Connects to GitHub to organise plans against issues.
These screenshots were captured by scripts/capture-portal-gallery.ts driving
the live portal with a real form login (Playwright + Chromium) and saved to
docs/static/img/gallery/.